Product design | Research
A collection of analytics designs, components, and visualizations I've created at Iterable.
When you're working with as much data as the modern marketer, you need ways to express that data in a way that is easy to digest and easily actionable. Since joining Iterable I've been able to craft a wide variety of different data visualizations that can be seen throughout the platform.
I believe the most important question to ask when designing visualizations for analytics is, "What should the data be able to answer for the viewer?" When I joined Iterable, establishing a process for answering that question was one of my first objectives and is something we have continued to refine and use still today.
I also built out a reusable data visualization pattern library and wrote the guidelines for how and when to use those visualizations. Each part was broken down to the atomic level to create data-viz components that could easily be added to any Figma design for rapid prototyping.
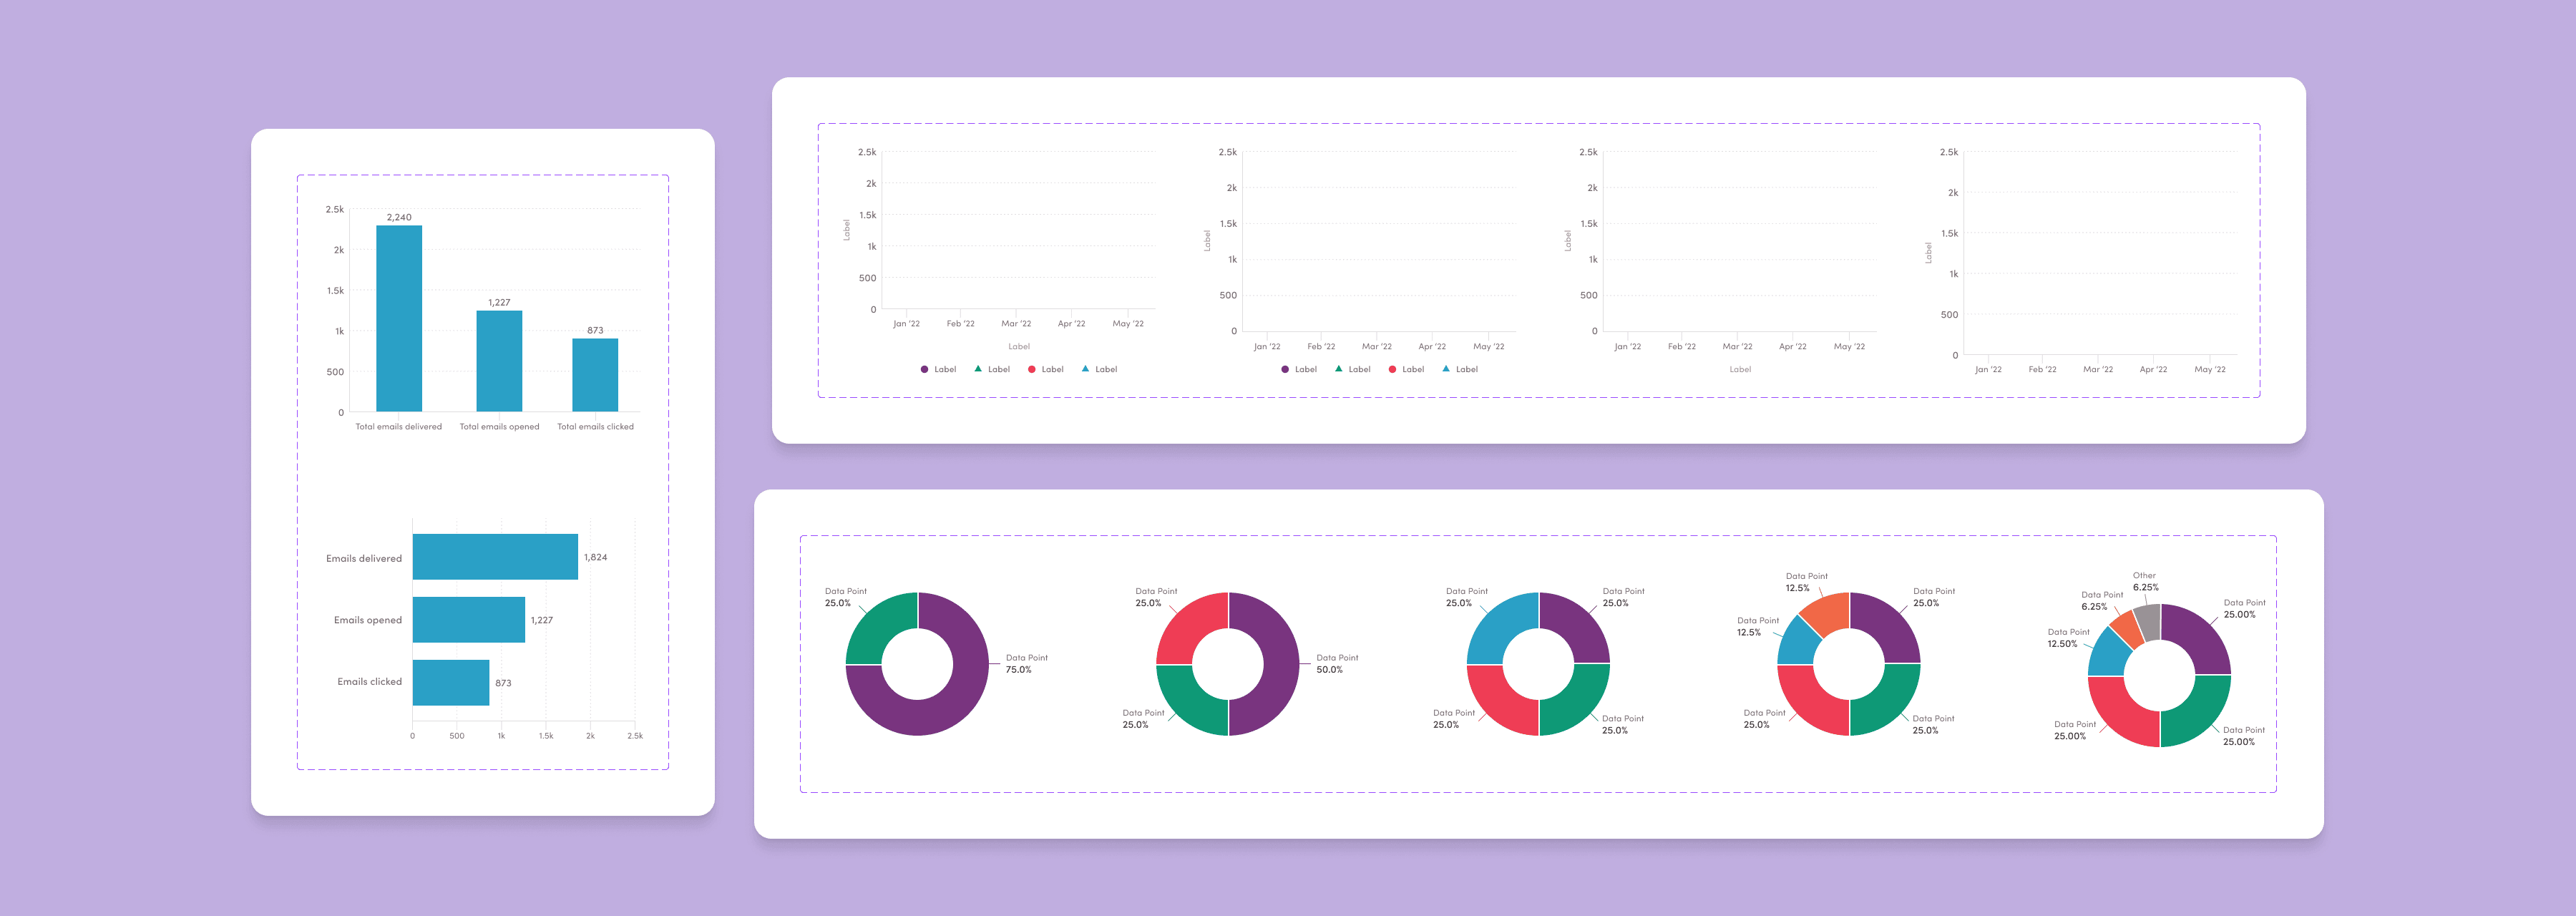
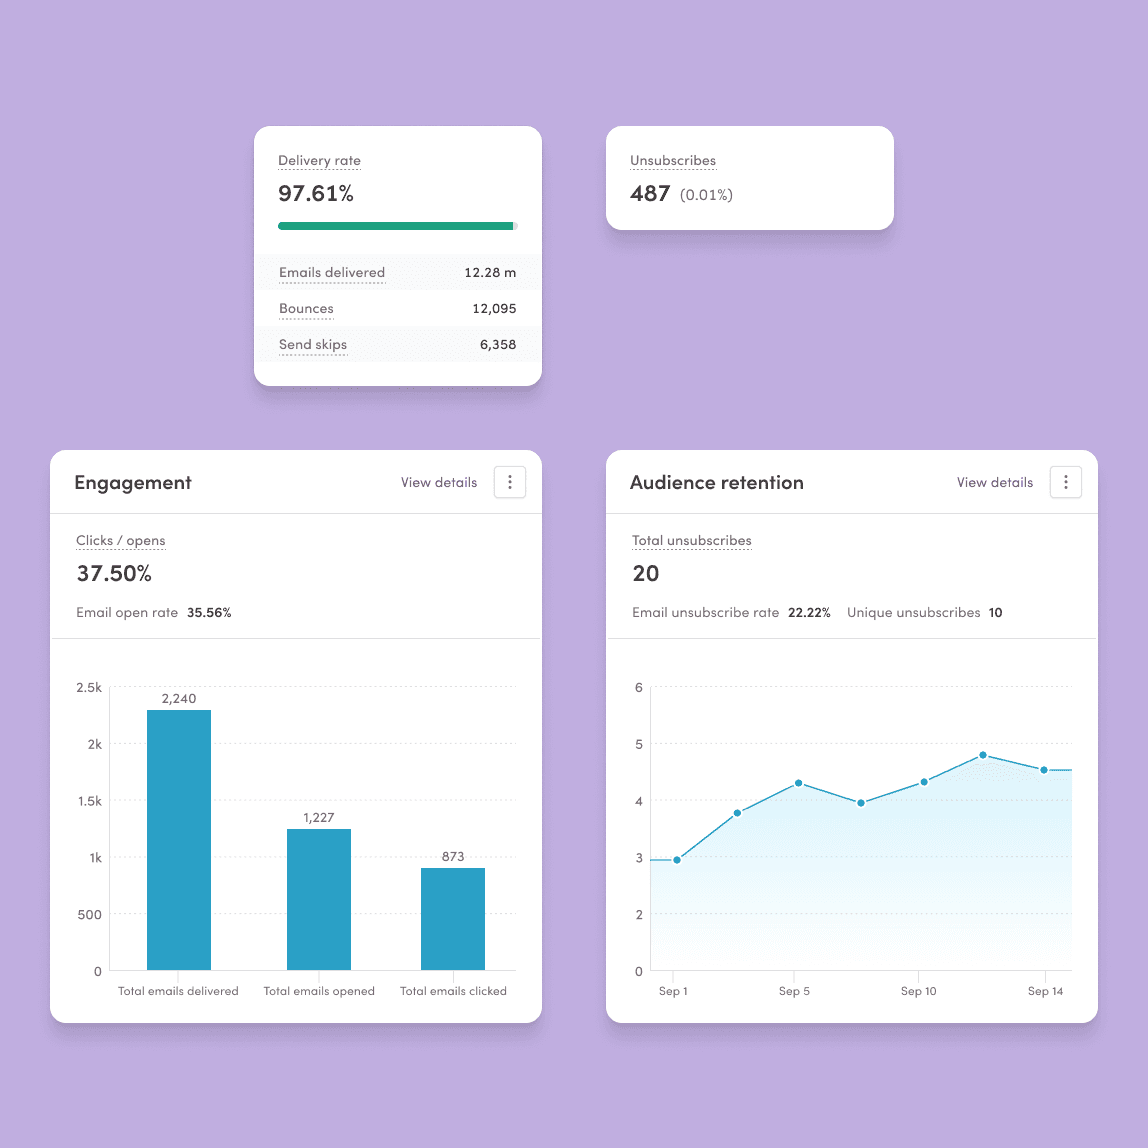
Some of the atomic component pieces designers at Iterable use to build custom charts.
The components also have a built-in color palette that was specifically curated to not only stay on brand with Iterable's colors, but also to ensure color contrast accessibility was baked in.
These charts components were then built out in React using Highcharts to make adding any of the standard visualizations a breeze for developers. All they needed to do was hook up the data source and they were ready to roll.
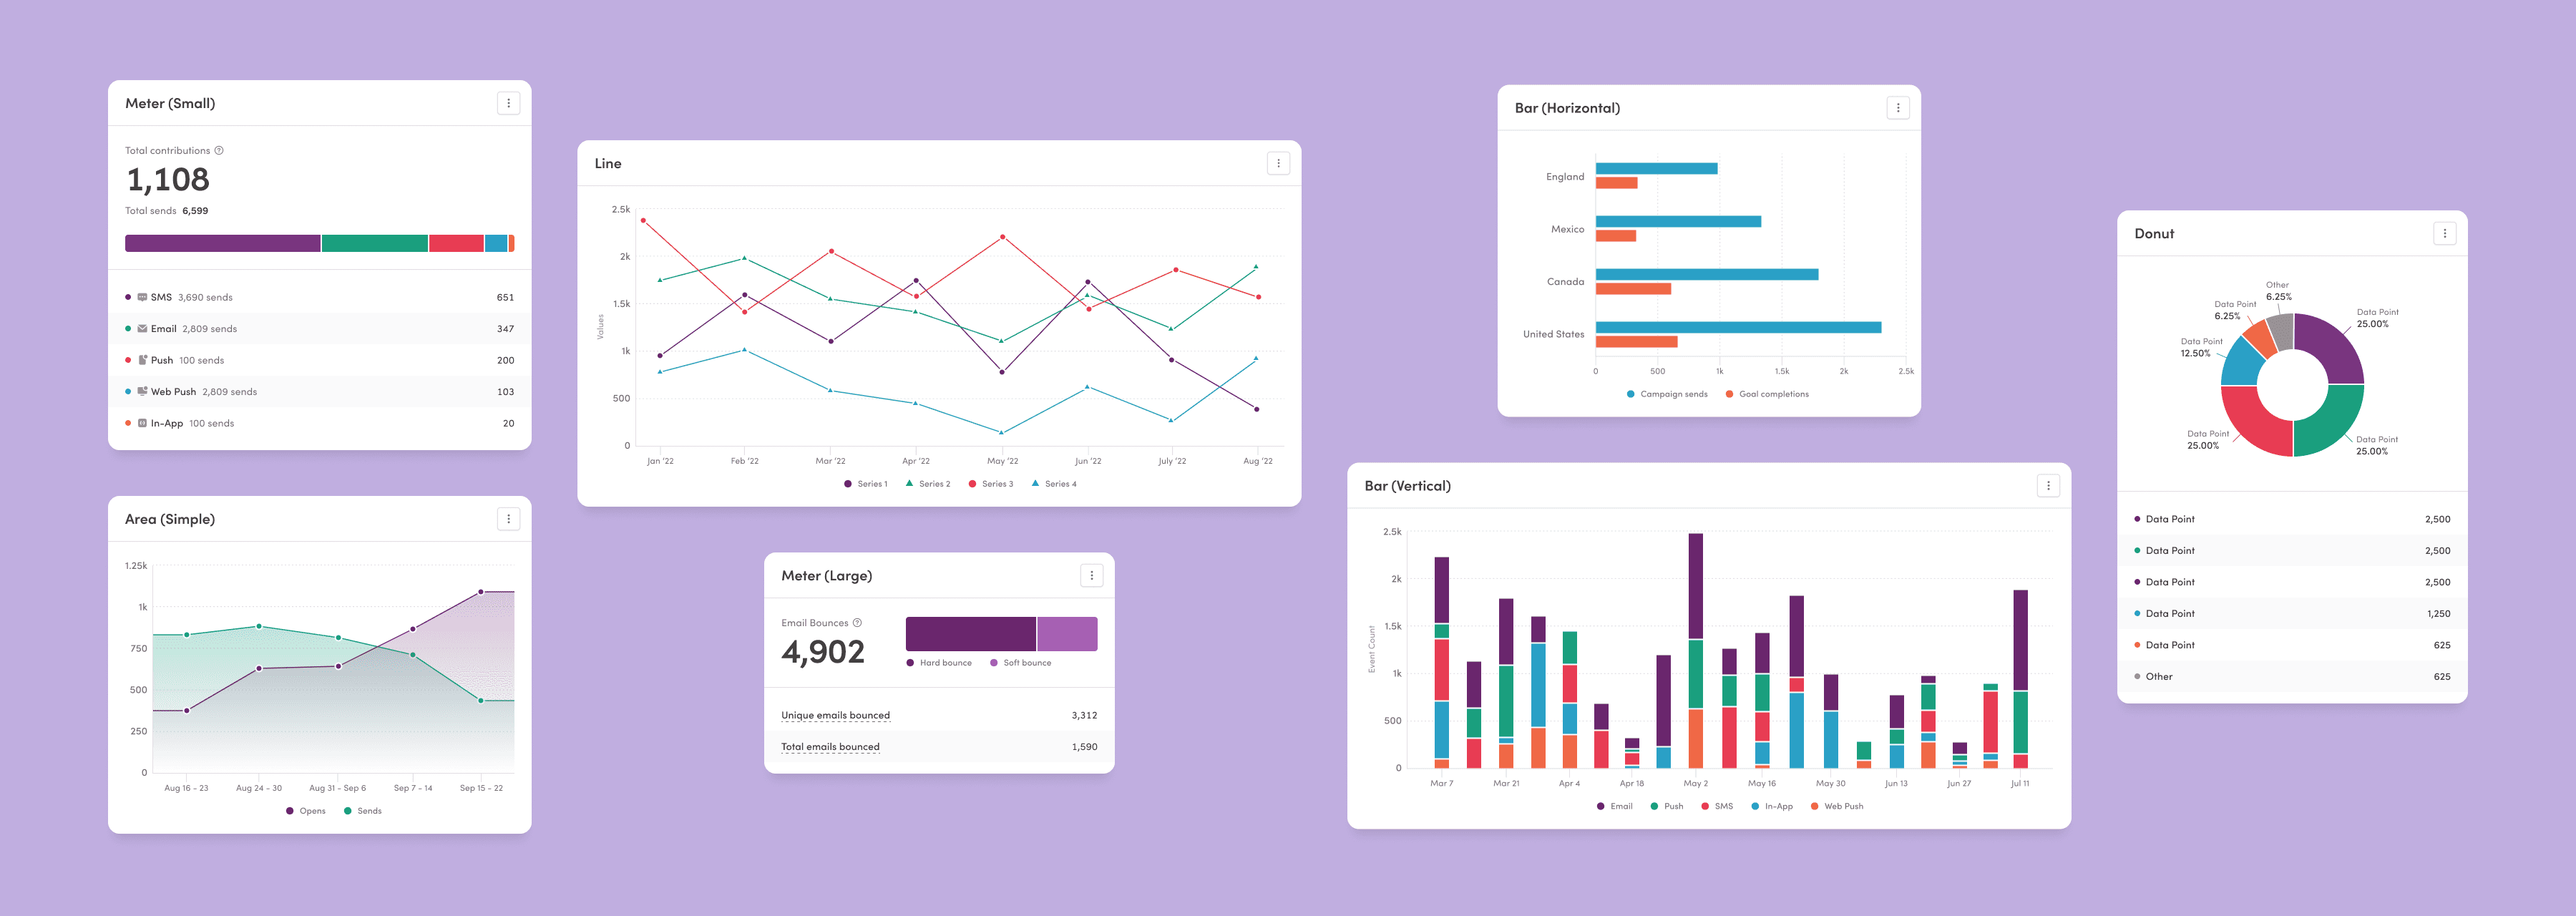
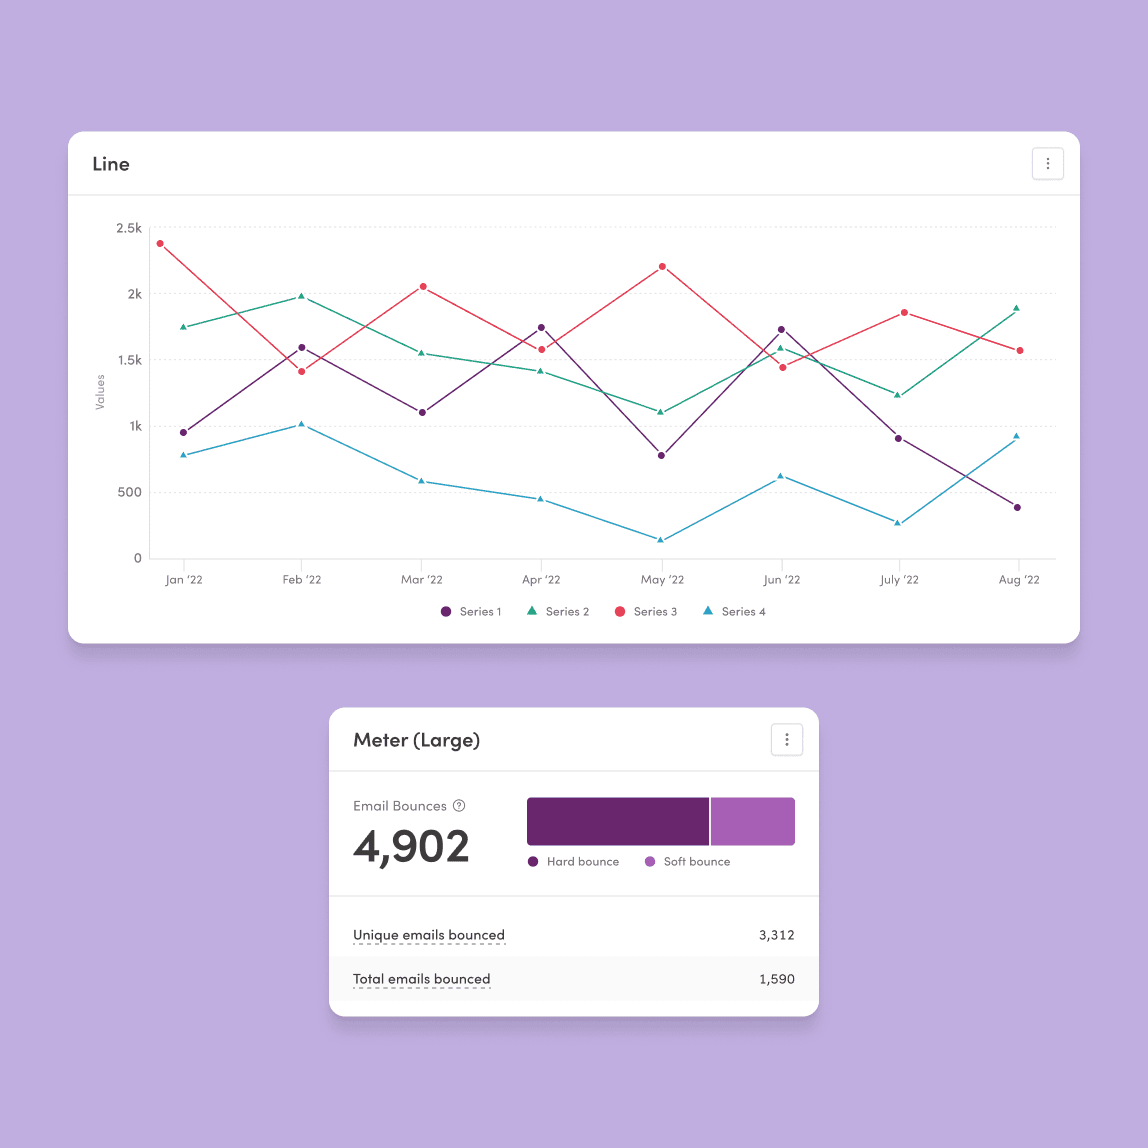
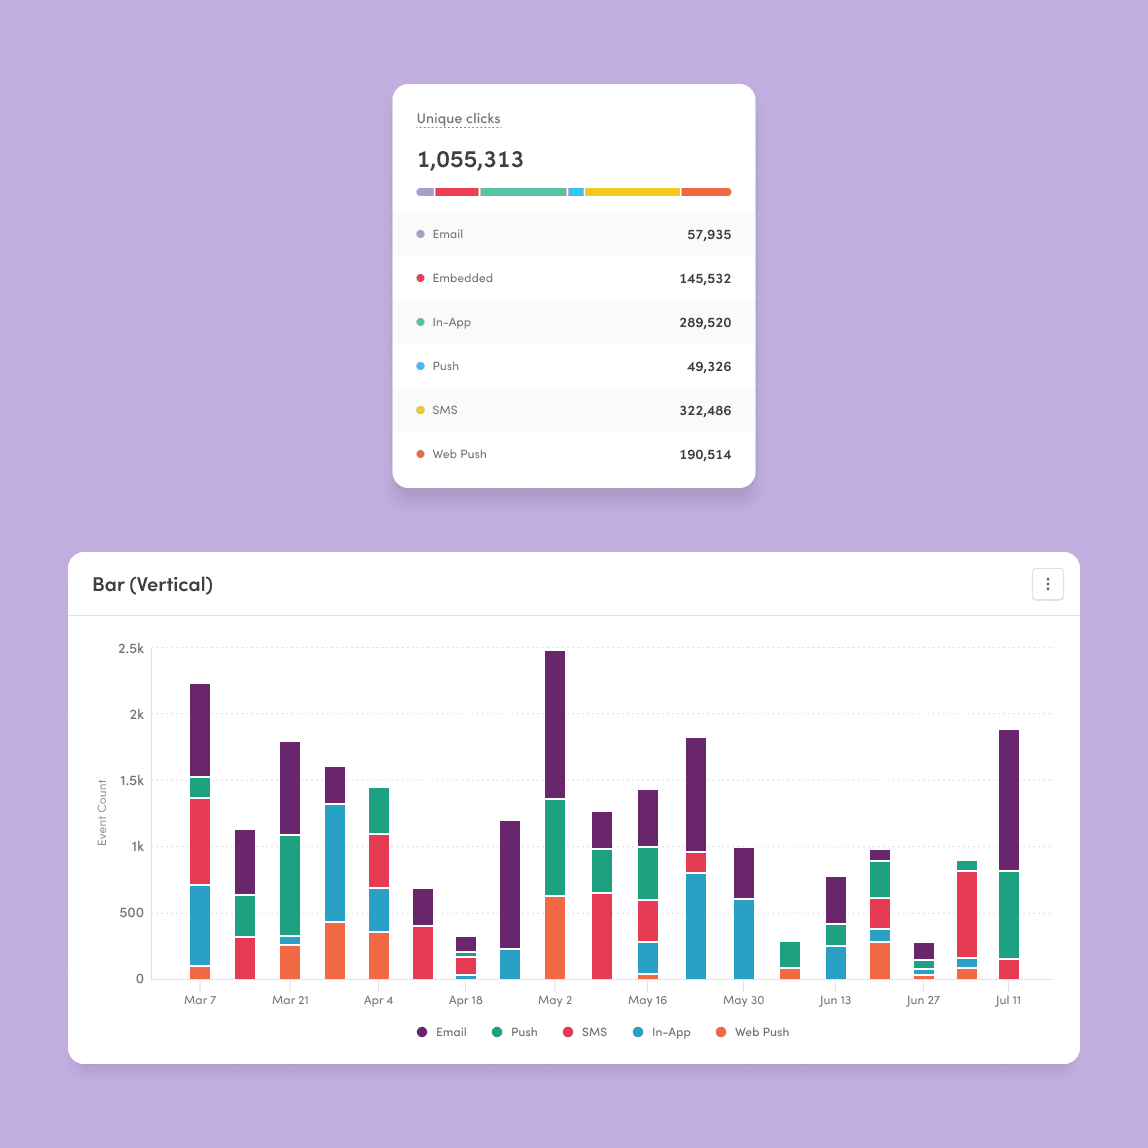
Examples of fully fleshed out chart components that Iterable designers have used throughout the platform.
While not every design gets developed, there have been plenty of opportunities to explore new ways of creating experiences within the realm of analytics. One such exploration that got picked up as a full project was Iterable's Enhanced Heatmaps feature.
For context, Iterable offers a heatmap feature that allows marketers to see where users clicked inside the emails they had been sent. It's a great way to get a sense of what content resonated the most with users, but the drawback was that it couldn't tell you when users clicked on "dynamic content" within the email.
Dynamic content is content that is selected, dynamically, based on the user who is intended to receive it. It's one of the most powerful tools marketers have to make their marketing personalized to individual users, but sadly the heatmap couldn't report on it…at least until I designed a new method of interacting with the heatmap.
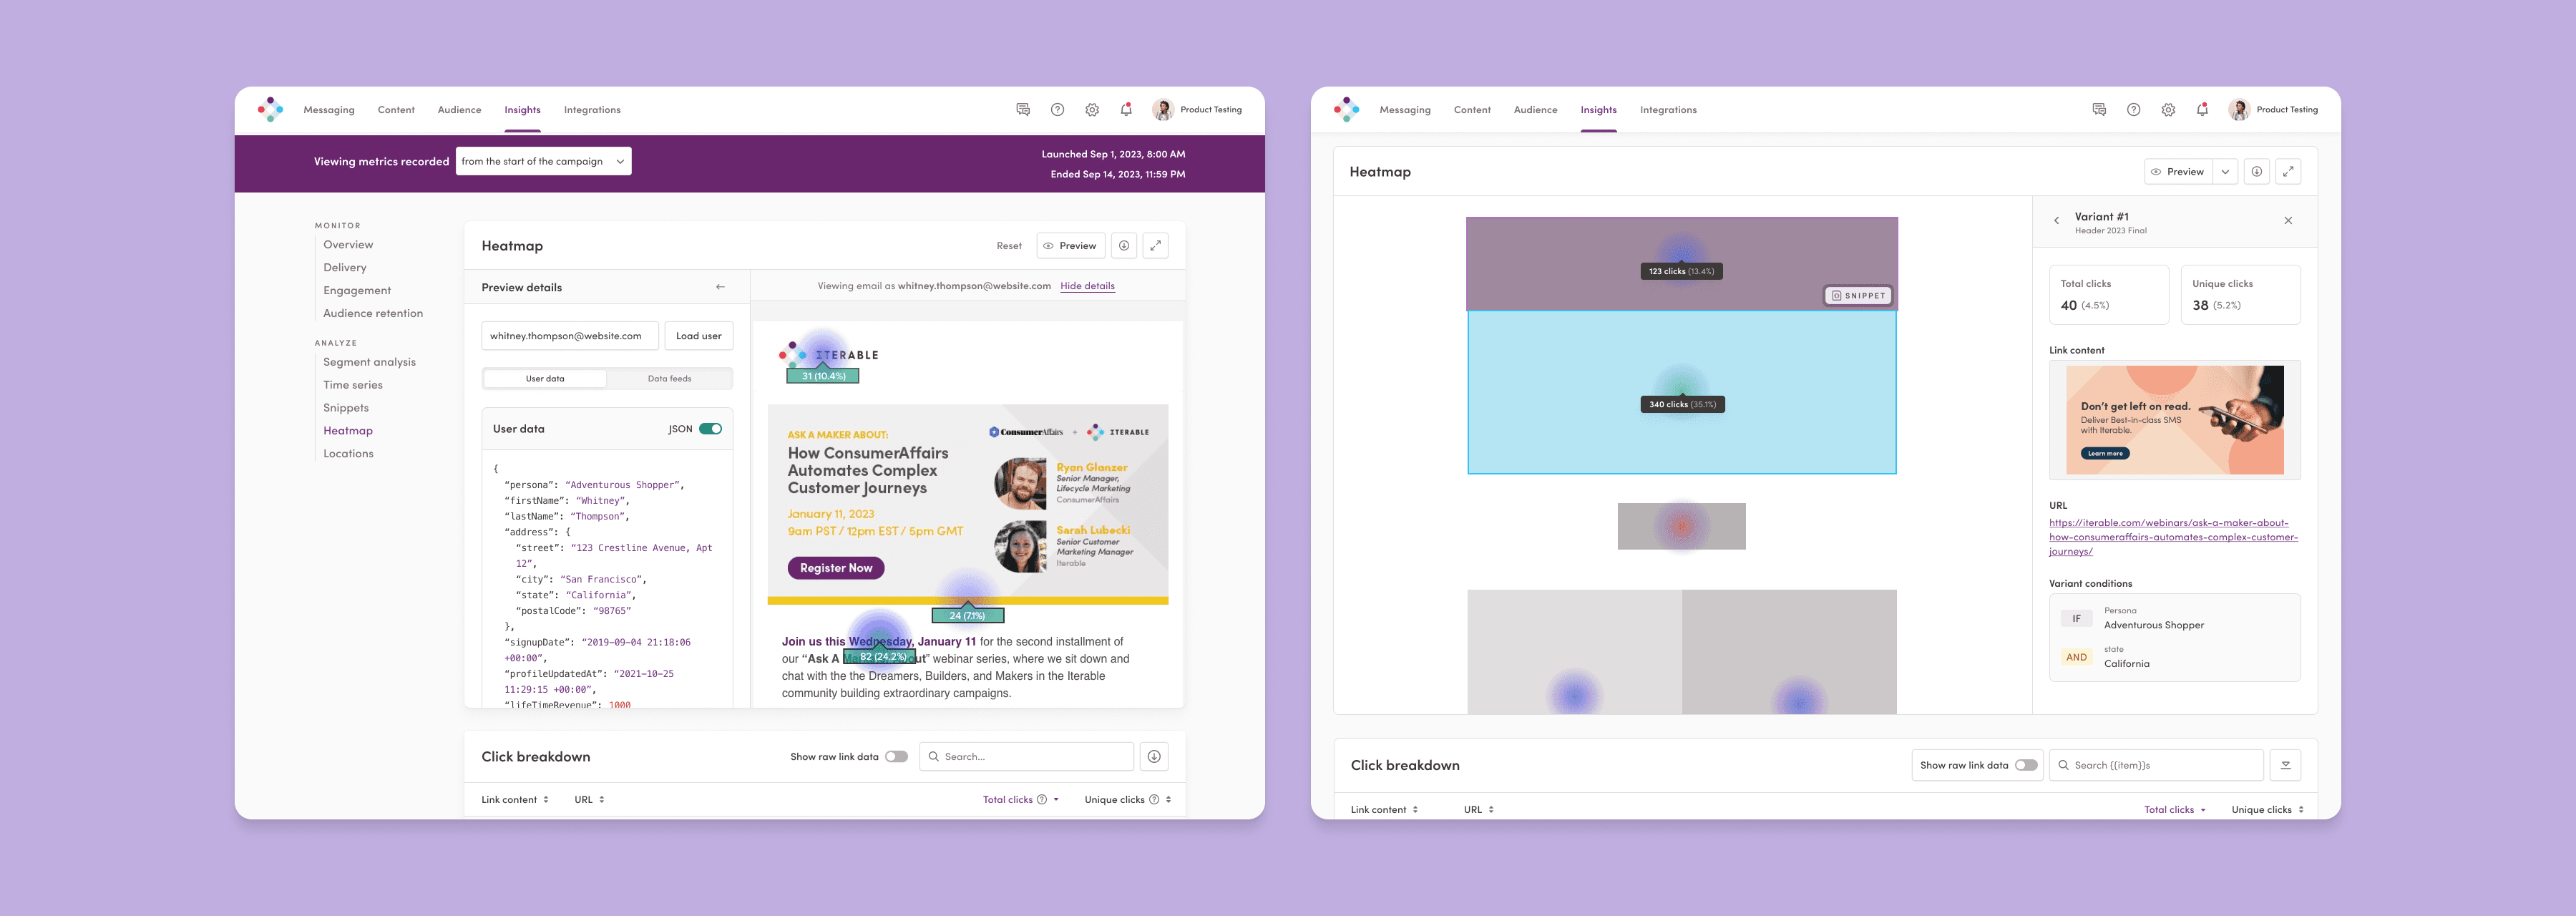
Left: Heatmap enhancements that allow heatmaps to display dynamic content. Right: The next evolution of the heatmaps to allow more direct user interaction.
For the first time, users could load actual user data into the heatmap and view the exact email that user got, while also seeing an aggregate of clicks around the specific content that was served to the user. This finally made it possible to see how various dynamic content pieces performed in a given email campaign. (Slated to go into beta by the end of September 2024)
But why stop there? What if users could click into the various sections of an email and extract data around every possible variant? Being able to drill down and see what conditions needed to be met for a user to receive that content and eventually see how that content has performed across every campaign its been inserted into.
That's the dream of the next phase of our enhanced heatmaps and I hope we can get started on it soon after we GA the first round of enhancements!
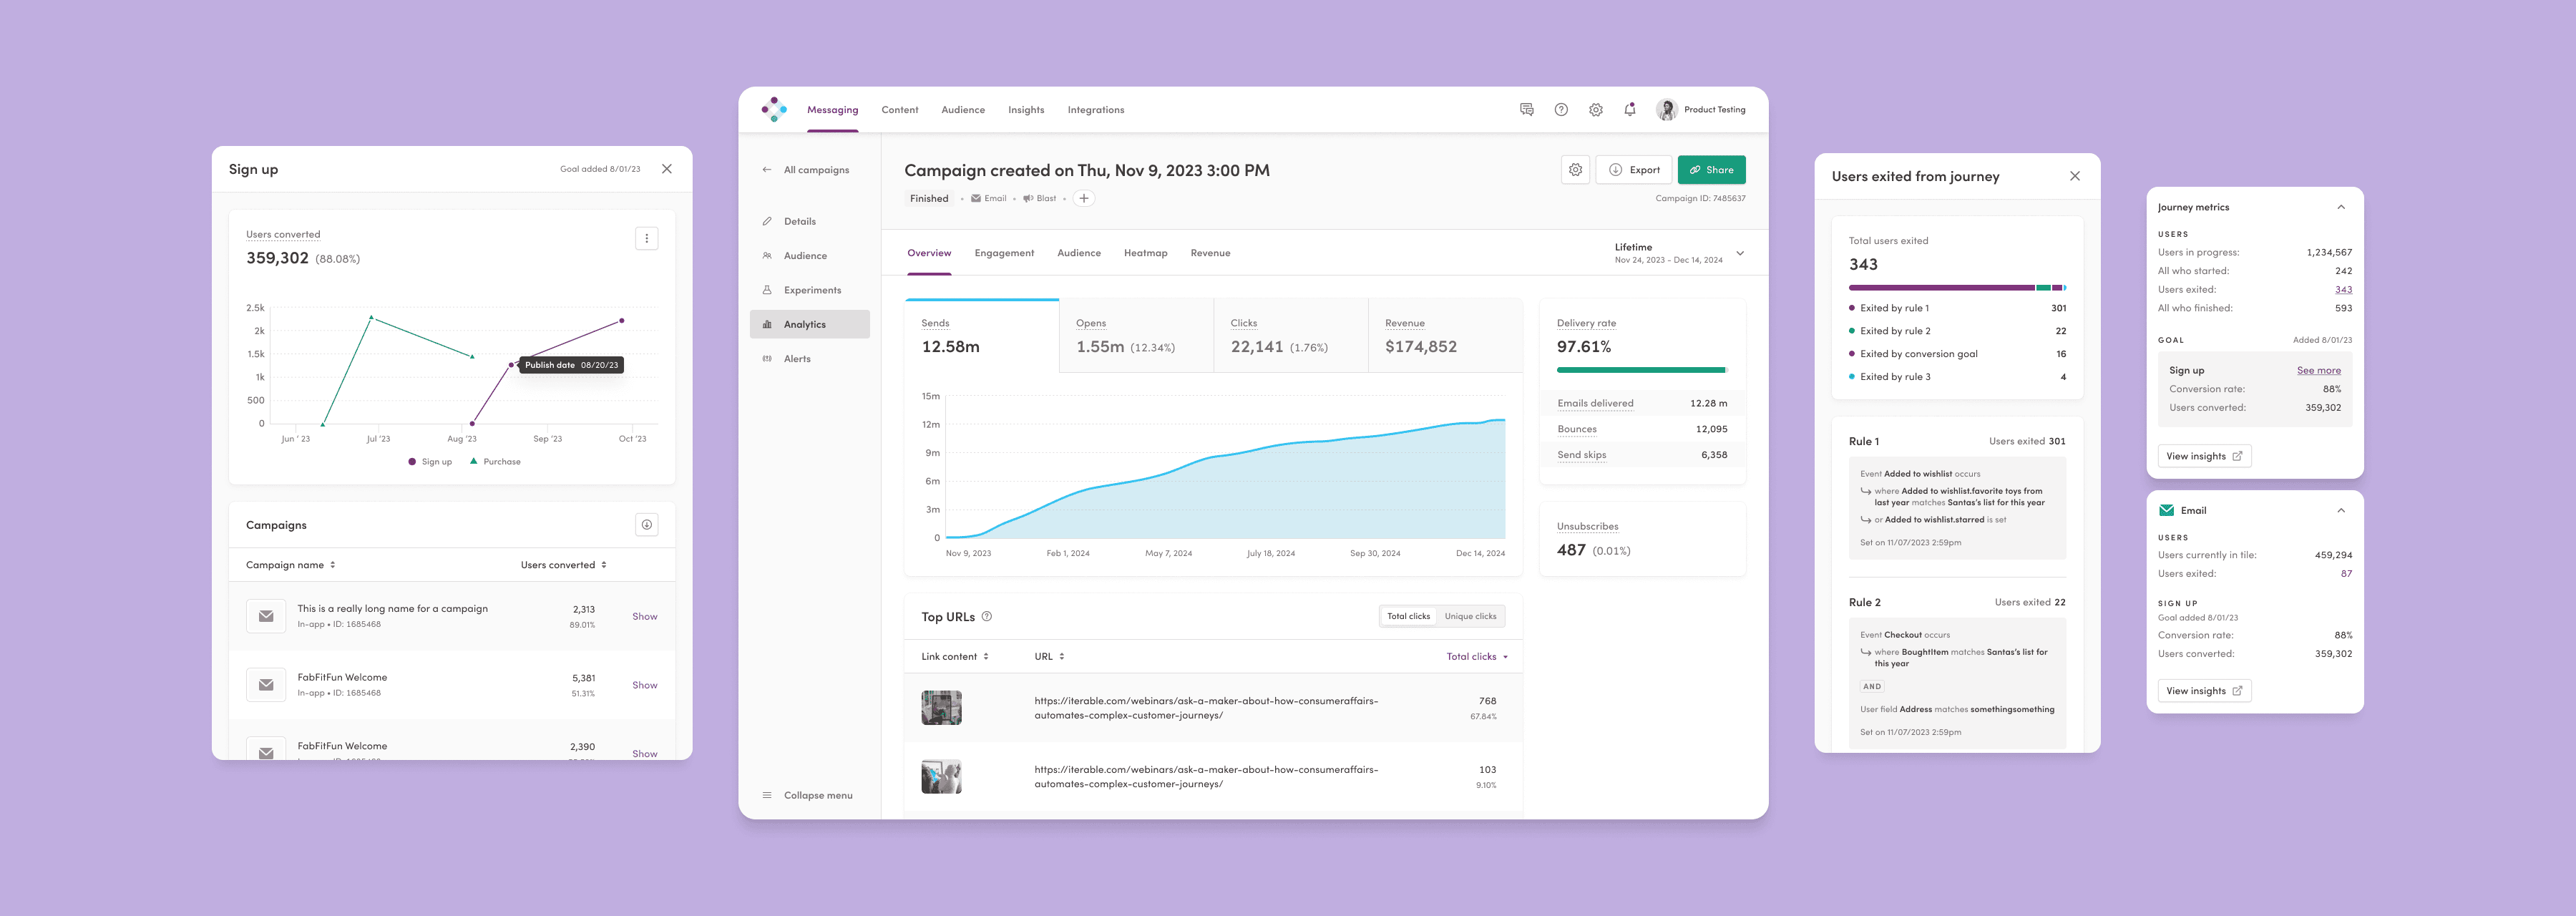
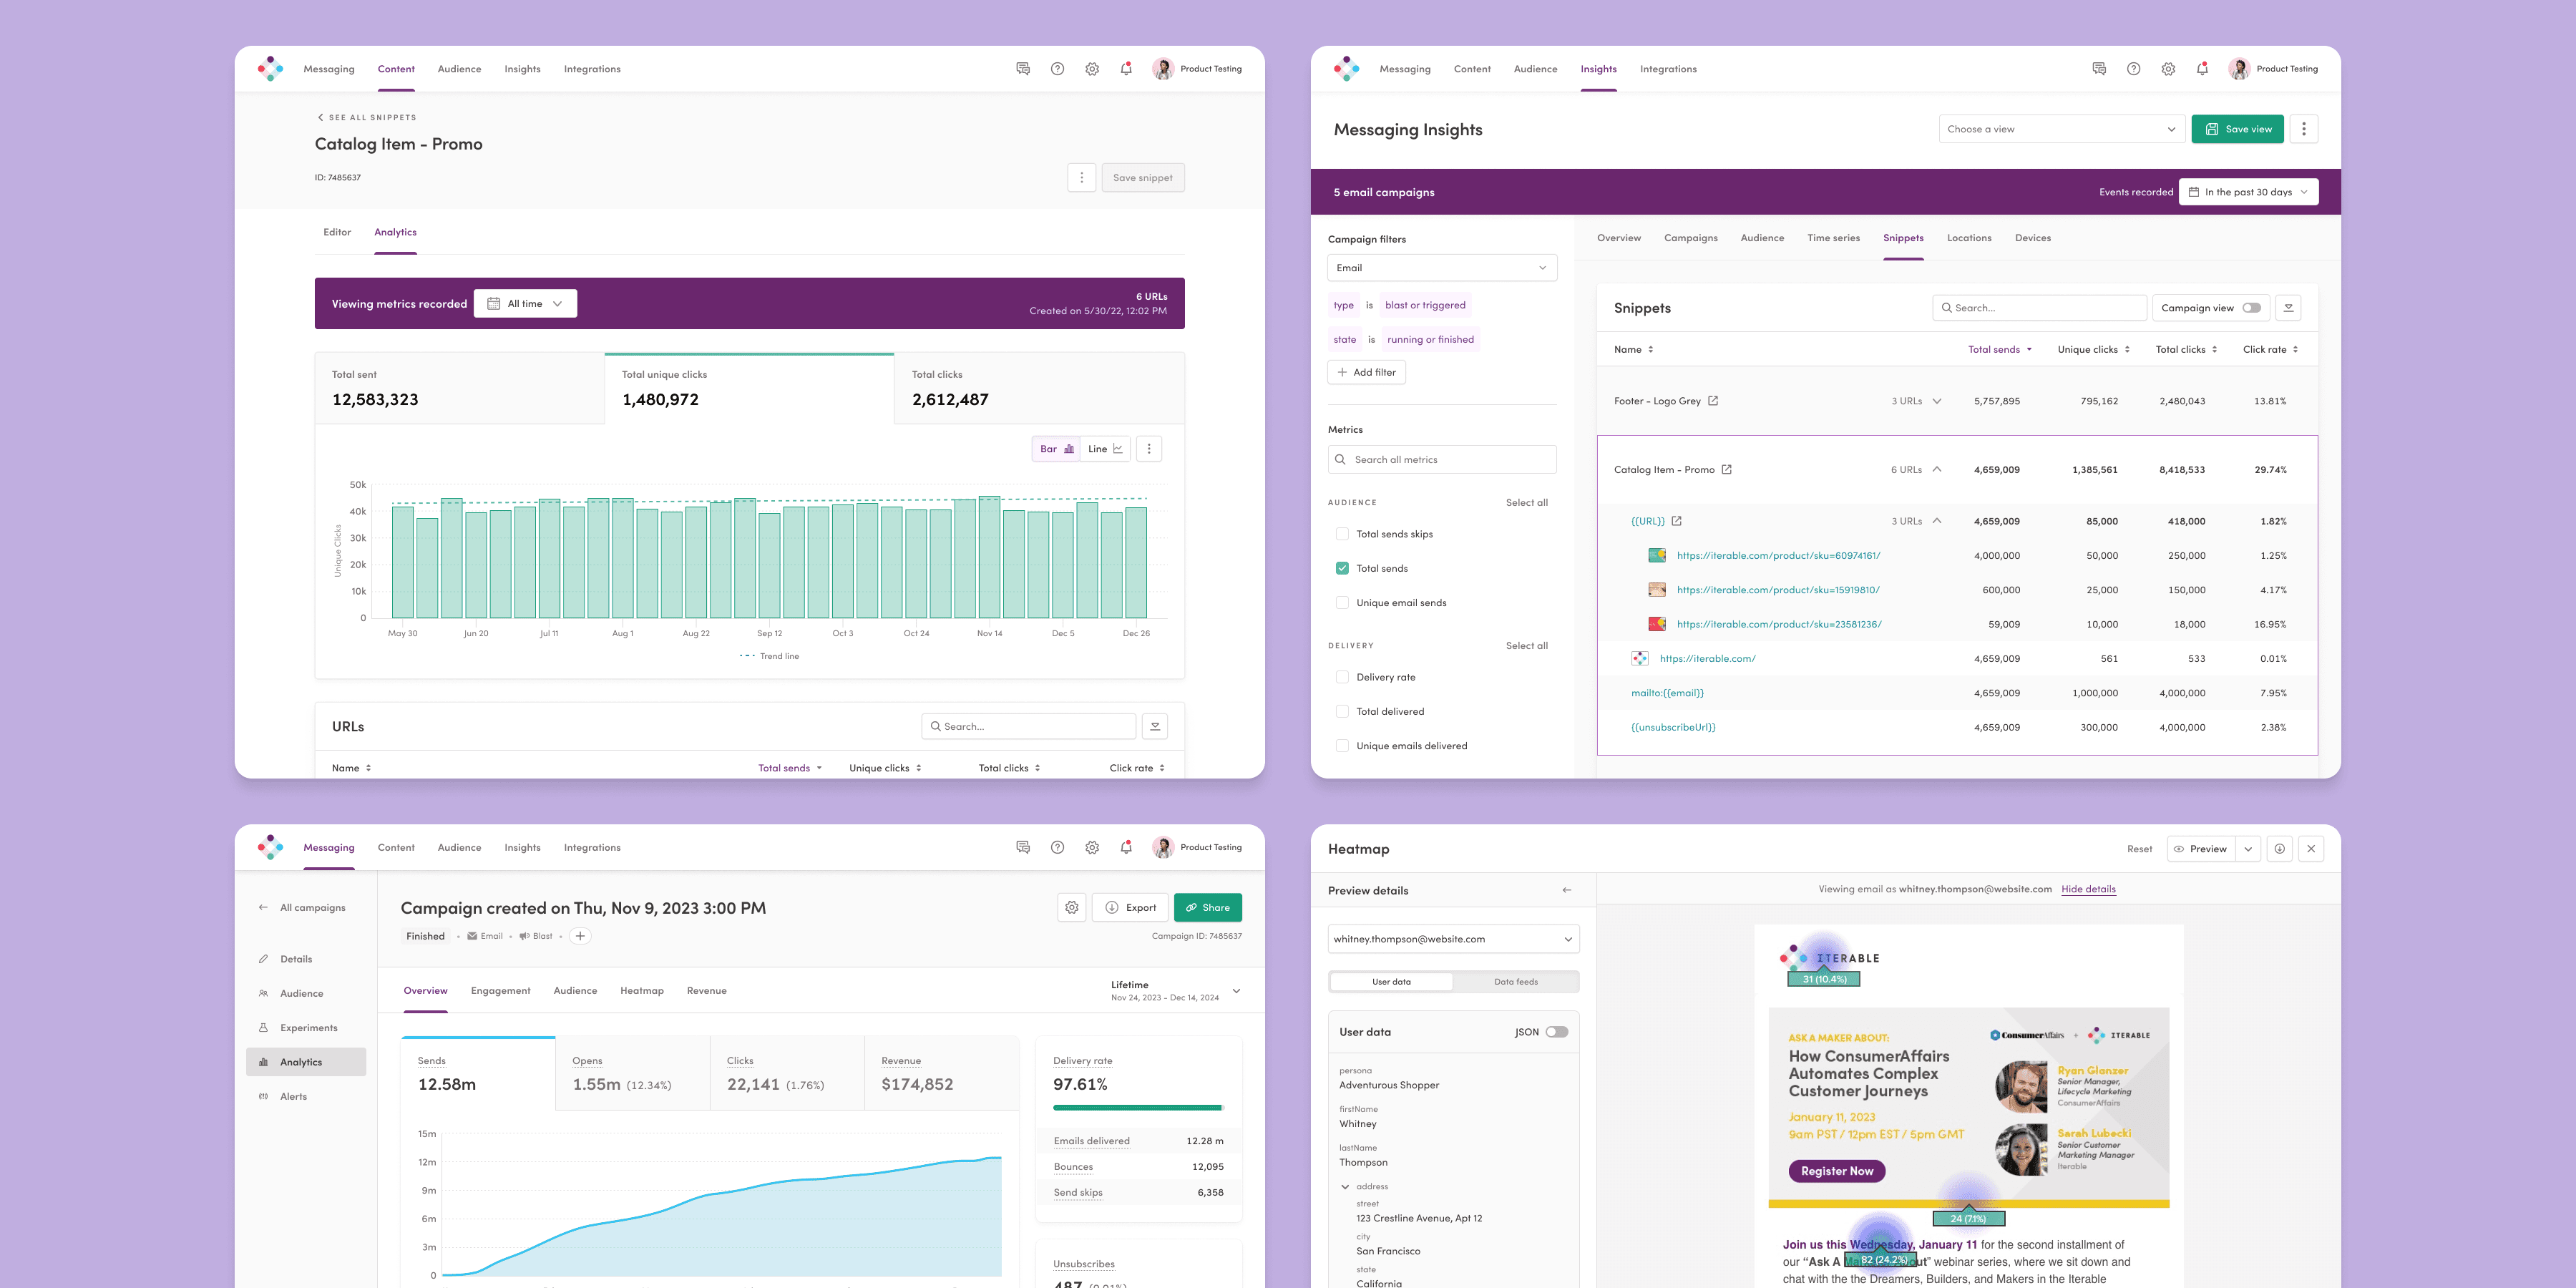
Other analytics concepts in various sections of the platform.
Outcome
While the various patterns, components and guidelines have offered a great jumping off point for Iterable's analytics products, there is still plenty of work to be done in evolving and refining the visualizations and in creating new ways for marketers to view and interact with their customer data.
I'm looking forward to seeing some of the new analytics features finally get into the hands of our customers though! And hopefully Iterable will continue investing in analytics and expand on the toolset available for future marketers to easily answer any question they can think of.
